
 In 2022 we were able to produce our most detailed analysis of client data from ‘The Business Analyser’ to date. There were a couple of reasons behind this, the main one being that Oudam Hunphy, our management accountant, has been able to take our analysis to another level. Having a dedicated person to lead our data analysis has added greatly to our capacity. Going forward Oudam, and the whole team, will be working to further improve the analysis, to make it easier for you to provide the data necessary and get the most value out of the analysis we do.
The second reason is that the volume of client data we have has grown over time, allowing more robust analyses to be conducted. In 2022, our client base managed $1.1 billion of total agricultural assets and generated $38 million of profit before interest and tax. As a result, we were able to send the most comprehensive analysis of our data set out to clients for them to compare their results against, including top 25% segregation by enterprise type, as well as whole business.
The 2022 financial year saw the highest profits generated in the more than ten years we’ve been analysing extensive pastoral businesses, fuelled by record beef prices. Land values and herd values are also the highest we’ve seen and this increase in asset value has meant that the record profits have not translated to record profitability (ROAM).
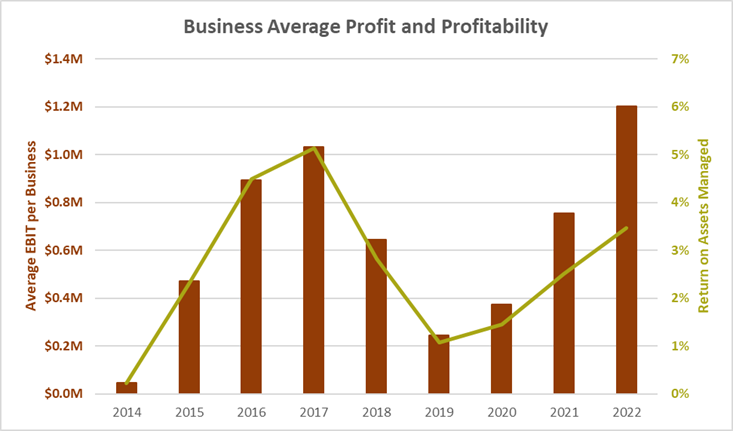 This is illustrated in the graph to the right, which shows the average EBIT (in real terms) and ROAM across our dataset. This year’s profits (EBIT) are higher than in 2016 and 2017, but return on assets managed is lower than those years.
At the enterprise level, it was only growing enterprises that did not have their highest EBIT/AE on record, theirs was slightly higher in 2017 in inflation-adjusted terms. The below graph shows the performance (EBIT/AE) of the different enterprises (excluding studs). The average performance shows that this stage of the cycle has favoured the breeding enterprise, whereas in the long term, the growing enterprises usually perform better on an EBIT/AE basis.
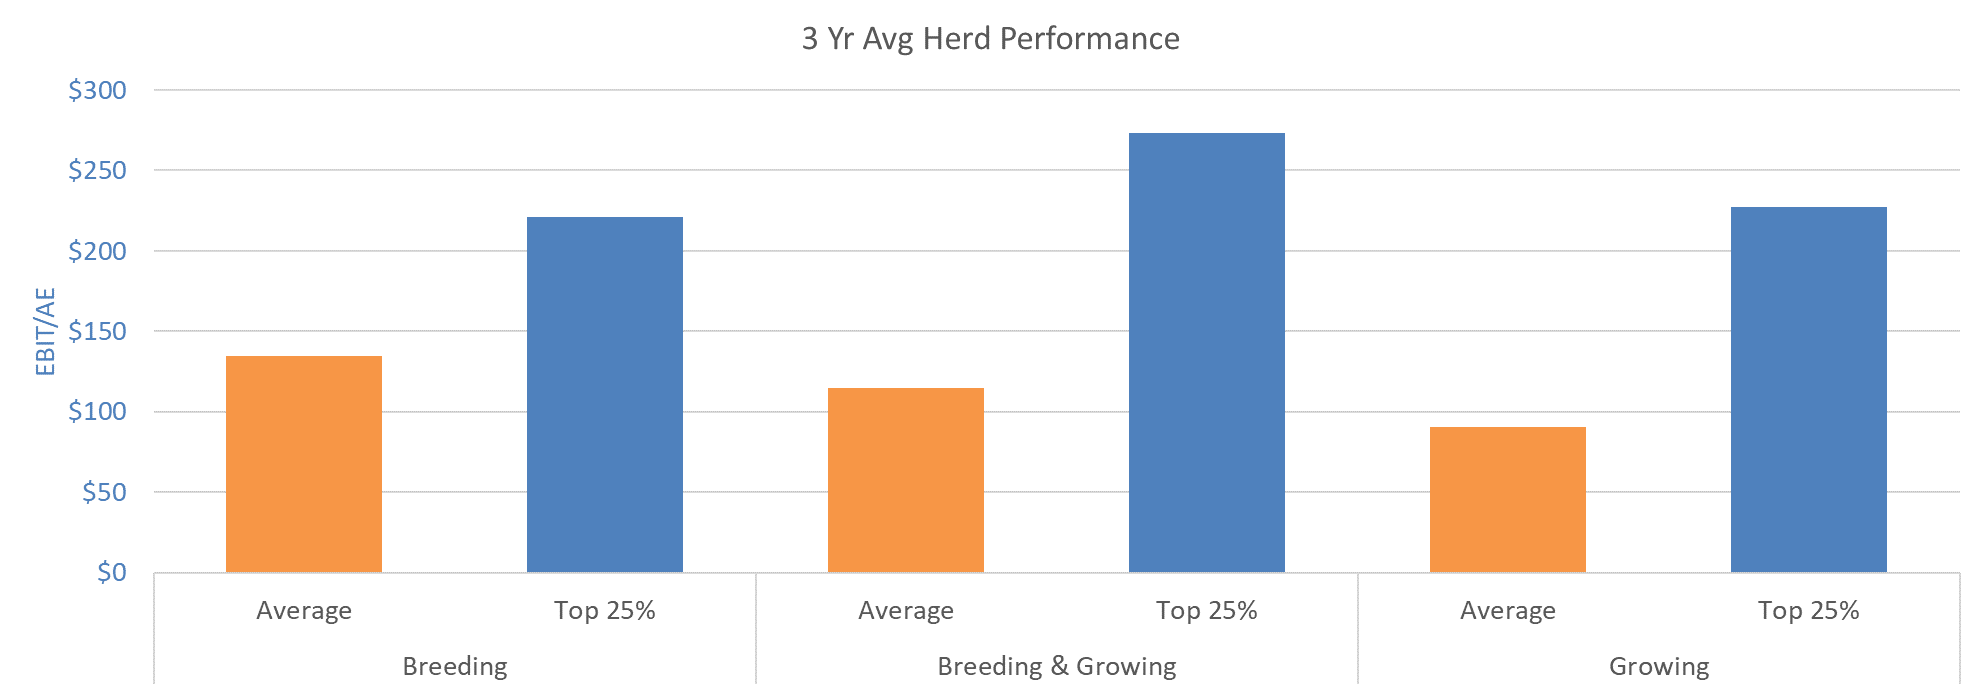
More important than the difference between enterprise types is the difference between the average and the top 25% of each, as is usually the case. By analysing the difference between the average and the top performers across these enterprises, we can see timeless fundamentals prevail. The top performers have;
- higher income per animal unit from better herd productivity not higher price received (Breeding & Growing is the only enterprise with a higher price received).
- lower enterprise expenditure which, when assessed in conjunction with their higher productivity, indicates their expenditure is better targeted, not just less.
- lower overhead expenses, a function of better labour efficiency and more operating scale.
The above factors, along with the matching of stocking rate to carrying capacity, are the core drivers of long-term beef enterprise profitability. These are the factors to focus on to improve profitability in the long term.
Thank you to those that entrust us with their business analysis, your data and knowledge provide the basis for a lot of what we do. If you aren’t getting your business analysed, want to know how you are performing, what your strengths and areas for improvement are, and are prepared to spend the time giving us good data so we can provide an accurate analysis back to you, Oudam or Joanne would love to hear from you.