
To properly analyse long term financial data, inflation needs to removed from the data to understand changes in real terms, which reflect the changes in purchasing power over time. We’ve updated our long-term analysis of the Queensland cattle market to include March data (to 25/3/24). This is shown in the graph below, which shows an index of Queensland cattle prices in real terms over the last 38 years. The coloured bands are the percentile ranges for the preceding 20 years.
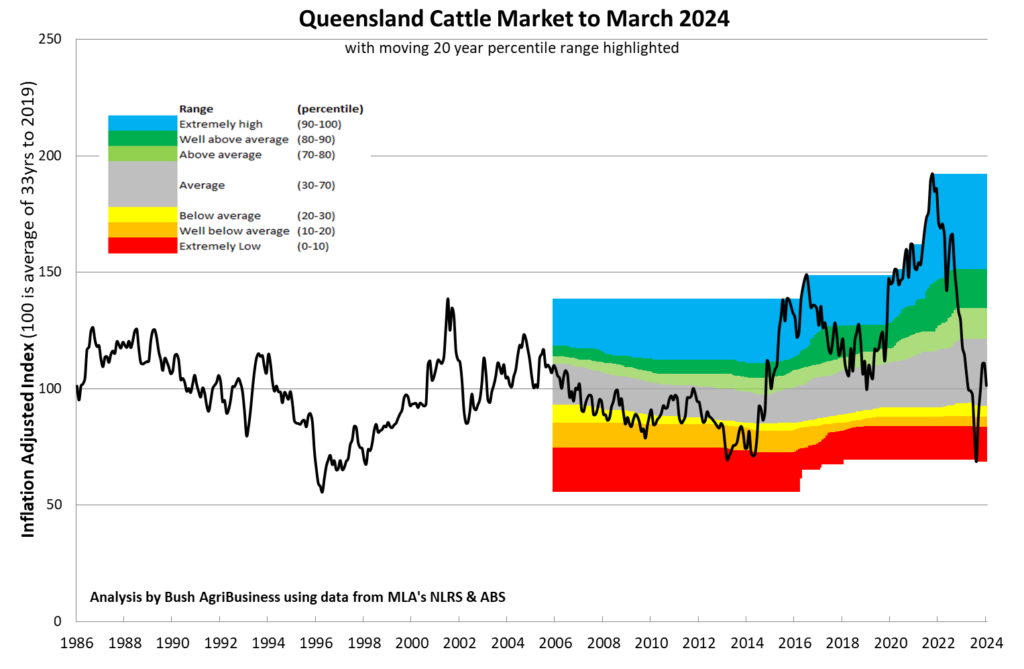
Queensland cattle prices are currently sitting at the 46th percentile of 20yr prices. While prices today do seem low relative to the high seen in December 2021, since which time they have dropped 47% in real terms, the cattle market has been lower than the current level for nearly half of the last 20 years.
While looking at long-term prices in this way does provide an important perspective to the current market, it does not tell us what future prices will be! Unfortunately, there is no way to know that, although the above graph does indicate that both the cyclical nature of prices and reversion to the mean are both pervasive features of the cattle market.
We suggest basing long-term budgets (e.g. for property purchases) on median long-term prices. A couple of years ago, this was viewed as incredibly conservative, but is proving prudent now. For shorter term budgets in our work with clients, we use deciles to determine budgeted prices, an estimate is still required, but the estimate ban be informed by the above graph, and a sensitivity can be done by changing one assumption (chosen percentile), rather than the price for each class/ transaction.
The below decile table shows the prices by broad class over the last 20 years, which we use for budgeting.
|
Decile
|
Yearling Steer
|
Yearling Heifer
|
Steers & Bullocks
|
Grown Females
|
|---|---|---|---|---|
|
0%
|
$2.11
|
$1.63
|
$1.98
|
$1.47
|
|
10%
|
$2.46
|
$2.29
|
$2.39
|
$1.87
|
|
20%
|
$2.61
|
$2.49
|
$2.51
|
$1.96
|
|
30%
|
$2.80
|
$2.64
|
$2.63
|
$2.09
|
|
40%
|
$2.95
|
$2.80
|
$2.82
|
$2.20
|
|
50%
|
$3.16
|
$2.91
|
$3.01
|
$2.33
|
|
60%
|
$3.37
|
$3.06
|
$3.20
|
$2.49
|
|
70%
|
$3.56
|
$3.33
|
$3.46
|
$2.68
|
|
80%
|
$3.93
|
$3.81
|
$3.72
|
$2.95
|
|
90%
|
$4.61
|
$4.48
|
$4.16
|
$3.33
|
|
100%
|
$5.85
|
$5.78
|
$5.16
|
$4.70
|